
New Credit Union Star-Ratings This Week
Total assets at the nation’s federally-insured credit unions rose 5.6% ($77 billion) during the 12 months ended September 30, 2018 ending up at $1.44 trillion. The loan portion of those assets was up 9.5% ($89 billion) to $1.0 trillion during that time-frame. The average outstanding loan balance in the third quarter 2018 was $15,268, which is 3.8% higher than a year earlier.
While the delinquency rate dropped from 79 basis points to 67 basis points over the course of the year, there is one area we are paying very close attention to, and that’s credit card loans. Like banks, where credit card loans grew 7.7% during the year, credit card loans at federally-insured credit unions rose 8.4% (or $4.6 billion) ending the third quarter 2018 at $59.4 billion.
As we reported last week when discussing banks, credit card interest rates tend to rise as the Fed Fund rate does, and will rise in tandem. So far, delinquencies have been kept in check. The credit card delinquency rate rose from 121 basis points to 127 basis points during the 12 months while most loan categories witnessed decreases.
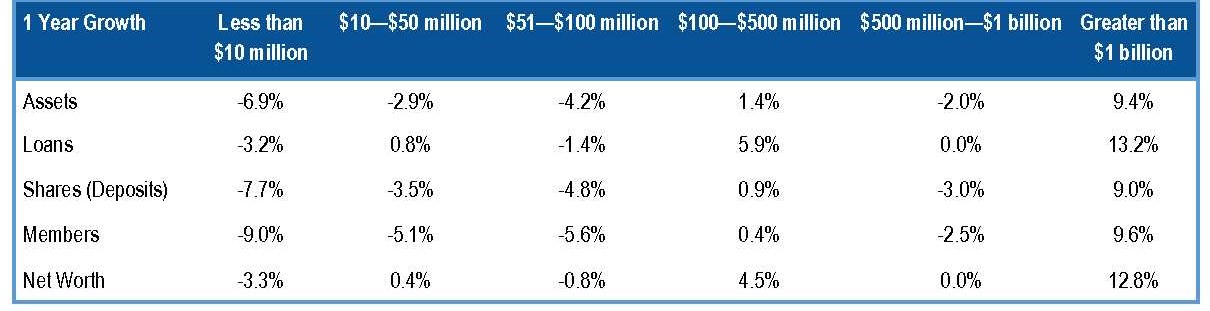
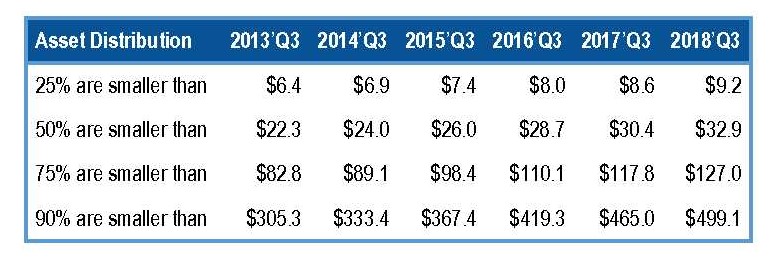
The number of federally-insured credit unions continues to decline; 206 were lost in the last year, and the 5,436 that remain are getting larger. The number of federally insured credit unions with assets of $1 billion or greater increased to 303 during the 12 months. These 303 institutions hold $939.8 billion in assets, 65% of total C.U. assets. These large C.U.s also had annual growth of: loans 13.2%; membership 9.6% and net worth 12.8%.
At the opposite end of the spectrum, the number of C.U.s with less than $10 million in assets dropped to 1,447 (from 1,562 a year ago). The $6.0 billion in assets held by this group represents less than 0.5% of total system assets. Loans were down 3.2%, membership 9% and net worth declined by 3.3%. The following chart depicts growth trends over the past 6 years:
As for star-ratings, 94% remained unchanged from last quarter, 80% have remained stable for the entire year. That means, in addition to the 206 that have disappeared since 9/30/2017, 20% have changed star-ratings at least once. All star-ratings are now updated on our website (banks and credit unions) so we would encourage you to check yours there to see if they are still satisfactory.
Chances are good that they are; the percent of credit unions rated 5-Stars or 4-Stars continues to rise to new heights while the percent of Troubled and Problematic credit unions (rated 2-Stars or below) is at its lowest level since the third quarter 2009. But, it just takes a minute to check and the peace of mind is well worth it, especially if your C.U. is in New Jersey. Over 8% of the credit unions in The Garden State are on Bauer’s Troubled and Problematic Credit Union Report ($99, or $225 for the Excel® Spreadsheet). Arizona, DC, Kansas, Montana, North Carolina and Utah also had a notable rise in T&P C.U.s.
All state recommended and T&P percentages are listed on page 7. The chart below shows the percent change in several categories over the last year by asset size. You can see, the large are getting larger while the small are being squeezed.