

Credit card balances generally drop during the first quarter as consumers pay down what they spent during the holidays. But not this year. According to The Federal Reserve Bank of New York’s Quarterly Report on Household Debt and Credit, credit card balances remained flat in Q1.
All other non-housing debt was up: auto loan balances increased by $10 billion; student loans were up $9 billion; and retail cards and other consumer loans were up $5 billion. That’s a $24 billion jump in one quarter. For today’s purposes, we want to narrow our focus to credit union automobile and credit card loans. The question we are asking is: “Is this jump in household debt an anomaly or is it a trend?”
During the fourth quarter ’22, credit card balances at credit unions were up 6.2% and for the year, they were up by 15.6%. As a percent of total credit union assets, credit cards barely make a dent, currently just 3.4%. At the end of 2018, credit card loans represented 4.3% of assets, but that’s about the highest we’ve seen it go. In fact, many credit unions still do not even offer credit cards.
Automobile loans tell a different story as they can represent up to as much as 25% of CU assets, bested only by real estate loans. Auto loans were up 20% in calendar ’22. Of that, only 2.9% was in the fourth quarter. New auto loans were more popular in 2022, growing 22.2% or $31.5 billion. Used auto loans, which enjoy a larger percent of the pie, grew by 18.9% or $49.56 billion.
At the end of 2022, 51 credit unions reported that at least 60% of their loan portfolio was in automobile loans and/or credit card loans. They each also reported an annual increase of at least 50% in either their automobile or credit card loan portfolio (or both). They can be found on page 5 of this week’s JRN. We limited our list to credit unions where loans account for at least 55% of total assets to ensure we had the credit unions with the highest reliance on these particular types of consumer loans.
Let’s take a look at a couple. 4-Star Solution First FCU, Enterprise, AL, for example, has total assets of $48.6 million. Of that, loans represent about 65% ($31.5 million). Solutions First does offer credit card loans, but they are minimal, totaling less than half a million dollars.
Automobile loans, however, represent 64% of Solution First’s total loans (new autos: 15% and used autos: 49%). At the end of 2022, three new car loan accounts and six used car loan accounts were 60 days or more delinquent. A sneak peak at their March data indicates that those delinquent new car loan accounts dropped from three to two ...but delinquent used car loans rose from six to eight. Let’s dig a little deeper.
At year-end, the three delinquent new auto loans represented $60,000. They were all between three and six months in arrears. The six delinquent used auto loans included: $45,000 that was three to six months past due and $22,000 that was past due 60-89 days. Shorter-term past due’s, those between 30 days and 60 days behind, are not yet considered “delinquent”, but $146,000 was potentially in the pipeline. (No new car loans were in this past due category.)
Another sneak peak into March 31st data reveals that the quality of those used auto loans is worsening, Not only is $157,000 now reported as 60 days or more delinquent but those in the pipeline rose as well, to $173,000 reported as 30-59 days past due. Once again, no new auto loans are in this short-term (30-59 day) past due category.
Now, were not trying to throw Solution First FCU under the bus, we are simply using it as an example. The fact is, Solution First’s 0.65% delinquent loan ratio is pretty impressive, and much better than the 0.91% reported by its peer group (credit unions with assets between $10 and $50 million).
Let’s take a look at another, larger credit union: 5-Star Space Coast CU, Melbourne, FL, with $8.5 billion in assets, is a very large auto lender in the state of Florida. Compared to its peer group (C.U.s with assets greater than $500 million), Space Coast has a much higher concentration of its loans in automobiles (59% vs. 31%). Another thing that sets Space Coast apart is that, at just 0.31%, its delinquent loan ratio is almost half of its peer group average (0.61%).
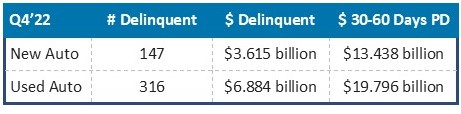
Understanding that this is a much larger CU than Solutions First, loans and delinquent loans are much higher as well. But, there is no appreciable difference between year-end 2022 and March 31, 2023 at Space Coast. At year-end, Space Coast had:
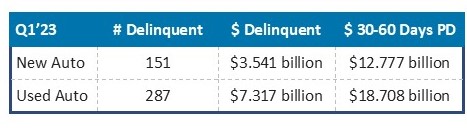
Our advance look at March 31, 2023 data:
For the size of this credit union, these numbers are not bad, certainly no indication that the Federal Reserve Bank of NY has uncovered a new trend.