
The Covid Pandemic has been over for several years now, but some areas are just beginning to feel the long-term effects of fewer customers and higher expenses.
Nationwide, all categories of problem loans ticked up over the 12-month period that ended September 30, 2024, but some states, particularly in the heartland, are being hit much harder than others.
Oklahoma, the Sooner State, which did not get its nickname by procrastinating, is falling behind the fastest in repaying bank loans.
JRN by Bauer 42:04
Problem Loans: a New Unwanted Guest in the Heartland
During the four years that ended 9/30/2024, total loans at our nation’s banks increased 15.7% (from $10.9 trillion to $12.6 trillion). The chart (below) shows what percent of those total loans were problematic at the close of each third quarter.
All categories of problem loans ticked up in the past year (including repossessed assets, which although not pictured, increased from 0.02% to 0.03% over the year). Banks see it too; they are also setting more money aside to cover for loan losses. These loan loss reserves remain below their pandemic highs, but have been rising since 2022 and now represent 1.76% of total loans.
Short-term past dues (30 to 89 days) are perhaps the most concerning line item on the chart, as this is often a precursor of things to come. Short-term past dues have exhibited persistent increases, totaling an increase of 25.5% over the four year period between September 30, 2020 and September 30, 2024.
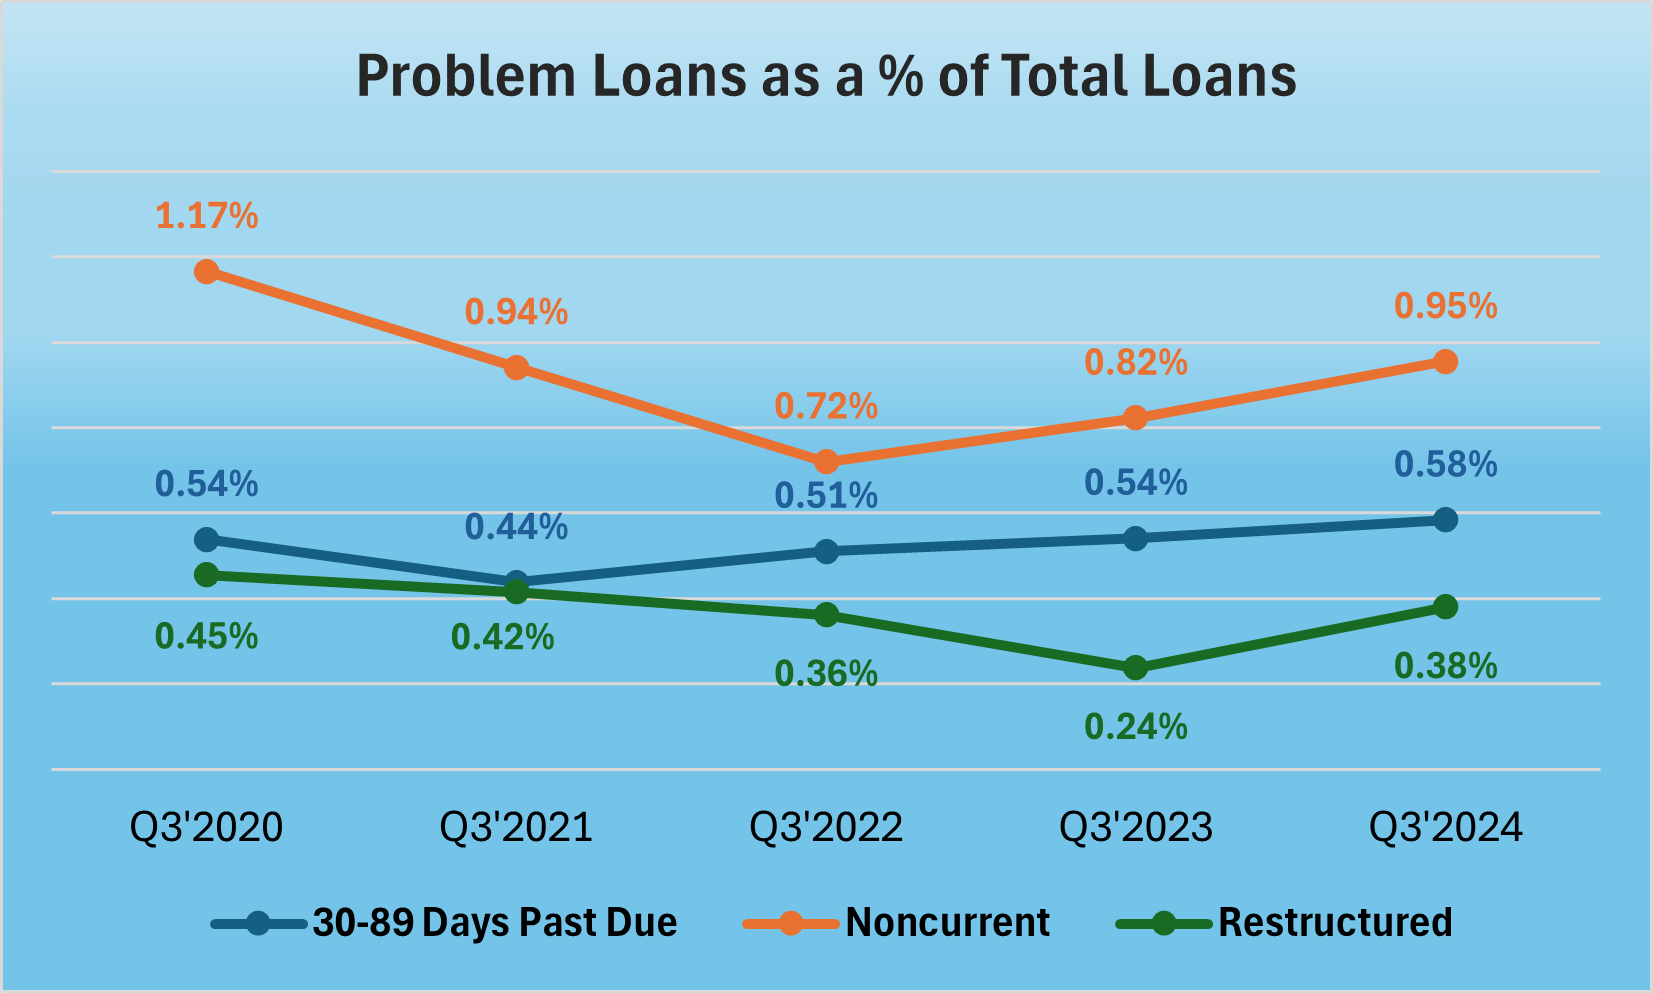
Source: FDIC Quarterly Banking Profiles
We will delve more deeply into different types of loans in coming weeks, but for today we are looking at overall loan quality.
In addition to being rated 3½-Stars or less by Bauer based on 9/30/2024 financial data, the 51 banks listed on page 5 each reported either a) a Bauer’s adjusted capital ratio below 2% at September 30, 2024 or b) a combination of a nonperforming assets to average tangible assets being greater than 3.4% and loan loss allowances sufficient to cover less than 60% of their delinquent loans.
We knew right away that problem loans were on the rise because we were forced to tighten our criteria from the last time we ran this list (JRN 41:36 based on June 30, 2024 data). Unchanged, the previous criteria would have resulted in 69 banks (too many for page 5). We just changed one variable. The non-performing assets as a percent of average tangible assets ratio increased from > 2.5% to > 3.4%.
In spite of that higher threshold, there are still 14 new additions to the list this quarter. They are highlighted in yellow, as is the criteria that put them on this list.
Two: (2-Star Community B&T-West Georgia, LaGrange, GA and 2-Star State Exchange Bank, Lamont, OK), reported drops in their Bauer’s Adjusted CRs to under 2%. State Exchange Bank didn’t pass the other test either. Along with the other 12 new additions, State Exchange Bank also has nonperformers exceeding 3.4% of the bank’s average tangible assets. And, in each case, reserves represent well below 70% of delinquent loans.
Another thing jumped out on page 5. With three new Oklahoma banks, the Sooner State now has a total of eight banks on this list. Not only is that more than any other state, it represents 4.5% of all banks headquartered in Oklahoma. (Illinois comes in a distant second with seven banks (or 2%) represented.) Most states have well under that. In fact, half of all U.S. states have zero representation at all.
The burning question is, why? Oklahoma City is the 20th largest city in the country and the 14th fastest growing. Most other Oklahoma cities are growing as well. However, it appears things never really went back to normal in this state after COVID.
Fewer customers and higher expenses are making the day-to-day struggle of many small businesses (particularly restaurants and bars) too difficult to overcome. That is extremely disheartening. These businesses survived through and even after the pandemic. Now, several years later, it has became too much.
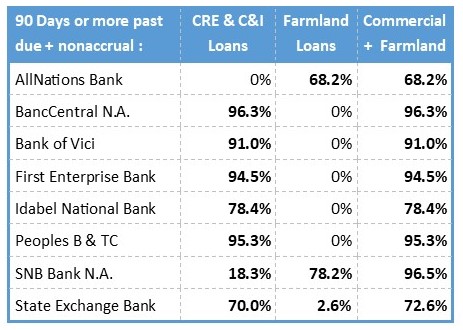
To determine which loans are driving up delinquencies in Oklahoma, we took a deeper dive into the call reports for the 8 on page 5. The ratios below represent the percent of all nonperforming loans that each bank reported for commercial (CRE+C&I) as well as farmland loans. Commercial loans represent the largest slice of the nonperforming loan pie, with farmland loans coming in a distant second. This is an unwanted guest in the Heartland.
2 comments on “Problem Loans: a New Unwanted Guest in the Heartland”
Comments are closed.