
All credit union star-ratings and financial data have now been updated with March 31, 2025 data.
Overall, first quarter credit union data was positive: assets, including most loans, were up and credit quality is generally still quite good.
However, uninsured shares/deposits continue to grow. In fact, we have listed 50 credit unions (on page 5) that are all less than “Well-Capitalized” and report uninsured shares/deposits at March 31, 2025. Uninsured shares/deposits at these 50 credit unions alone exceeds $2 billion.
New Credit Union Data and Star-Ratings
Overall, first quarter credit union data was positive: Total assets at our nation’s federally-insured C.U.s increased by $60 billion, or 2.6%, during the 12 months ending March 31, 2025, bringing total industry assets up to $2.37 trillion.
Of that, $52.8 billion was in the form of loans, which increased 3.3% over the year. The breakdown was: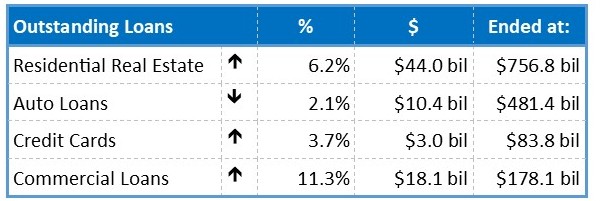
Credit quality is generally still quite good as well, even though the delinquency rate increased another two basis points (bps) (after a 25 bp jump in the previous 12 month period). Now at 0.80%, the overall delinquency rate is up slightly from a year ago, but remains well below the 1% mark ...in most categories.
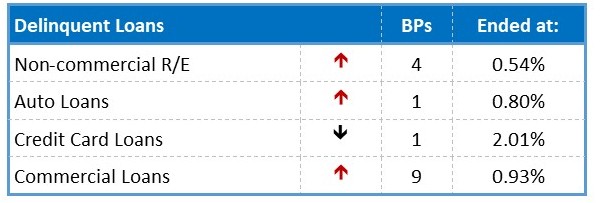
Credit cards are the obvious exception with a delinquency rate over 2%. Even that, though, is heading in the right direction (down), albeit very slowly.
As for liabilities: shares and deposits rose 4.5% (or $86.1 billion) to end the first quarter at $2.02 trillion. Regular shares increased 0.3% while other deposits were up 6.9%. The growth leader was share certificate accounts, which grew 10.3% (or $53.2 billion) from a year ago.
This is where it gets really interesting: uninsured shares and deposits rose 12.9% to $188.4 billion. For comparison, total shares and deposits rose just 4.4%.
It was just over two years ago that three high-profile bank failures spooked people into obtaining maximum deposit insurance coverage. Uninsured shares and deposits at credit unions and banks decreased as a result. But, people can have short memories, and uninsured deposits are building up again, and quickly. The worst part is the apparent lack of regard to the financial health of the institution.
To that point, the 50 credit unions listed on page 5 are all less than “Well-Capitalized” by regulatory standards. They also each reported some amount of uninsured shares/deposits at March 31, 2025. Uninsured shares/deposits at these 50 credit unions alone exceeds $2 billion.
We noted a year ago that the scare was wearing off (JRN 41:24). That was when uninsured credit union shares/deposits first returned to their previous high of $166 billion. Today, they top $188 billion and are poised to continue growing… probably until the next scare.
Of the 50 listed on page 5, two are Critically-Undercapitalized, four are Significantly-Undercapitalized and nine (including those six) are rated Zero-Stars. One of the Critically-Undercapitalized Credit Unions, Zero-Star Eastern Kentucky Federal Credit Union, Prestonsburg, KY (19280), no longer exists. It was acquired on April 30th by 5-Star Commonwealth FCU, Frankfort, KY (24970).
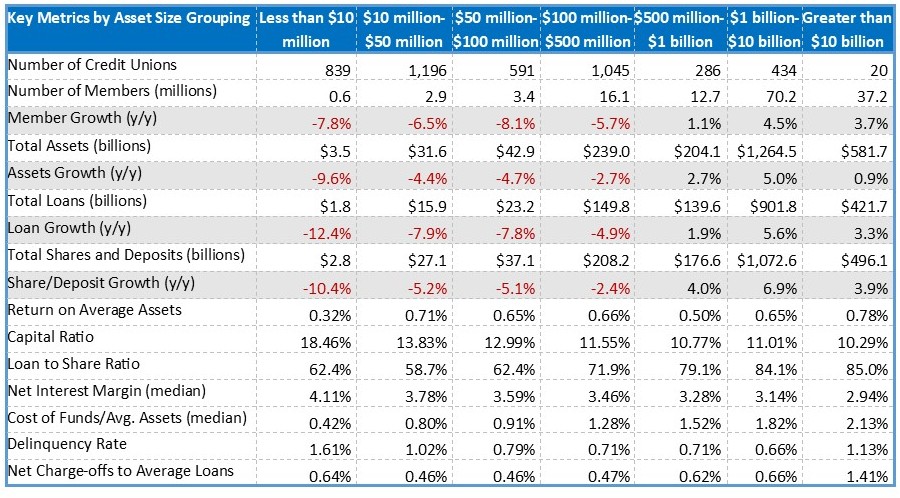
Moving on to another dubious trend, for a long time, large credit unions have reported the strongest growth in membership, assets, loans and shares and/or deposits. The chart below drives that point home. The largest loss percentages appear in the smallest credit unions and lessen as the institutions get larger. Positive growth isn’t seen until we reach assets of $500 million. It’s a sad truth.
Source: National Credit Union Administration Quarterly Credit Union Data Summary 2025 Q1