
The Federal Reserve held interest rates steady at the FOMC’s two day meeting last week (between 1.75% & 2%) but the six quarter-point increases since December 2016 have slowly and steadily been making their presence known. Net interest margins (NIM) at FDIC-insured banks increased 30 basis points between the first quarter 2015 and first quarter 2018.
While smaller banks are overshadowed by the largest banks, it’s interesting to see that even the smallest community banks have seen improvements in NIM, which for banks with assets less than $100 million went from 3.58% to 3.75% in the past three years. Those with assets between $100 million and $1 billion saw slightly less improvement (3.62% to 3.75%) during that time-frame. Both groups have done a great job taking advantage of interest rate hikes.
The next asset group ($1 billion to $10 billion) is a whole other story. This group’s NIM plummeted between 1st quarter 2015 and 1st quarter 2016. Not only is this group lagging behind the smaller banks, it is still trying to regain prior losses (see chart).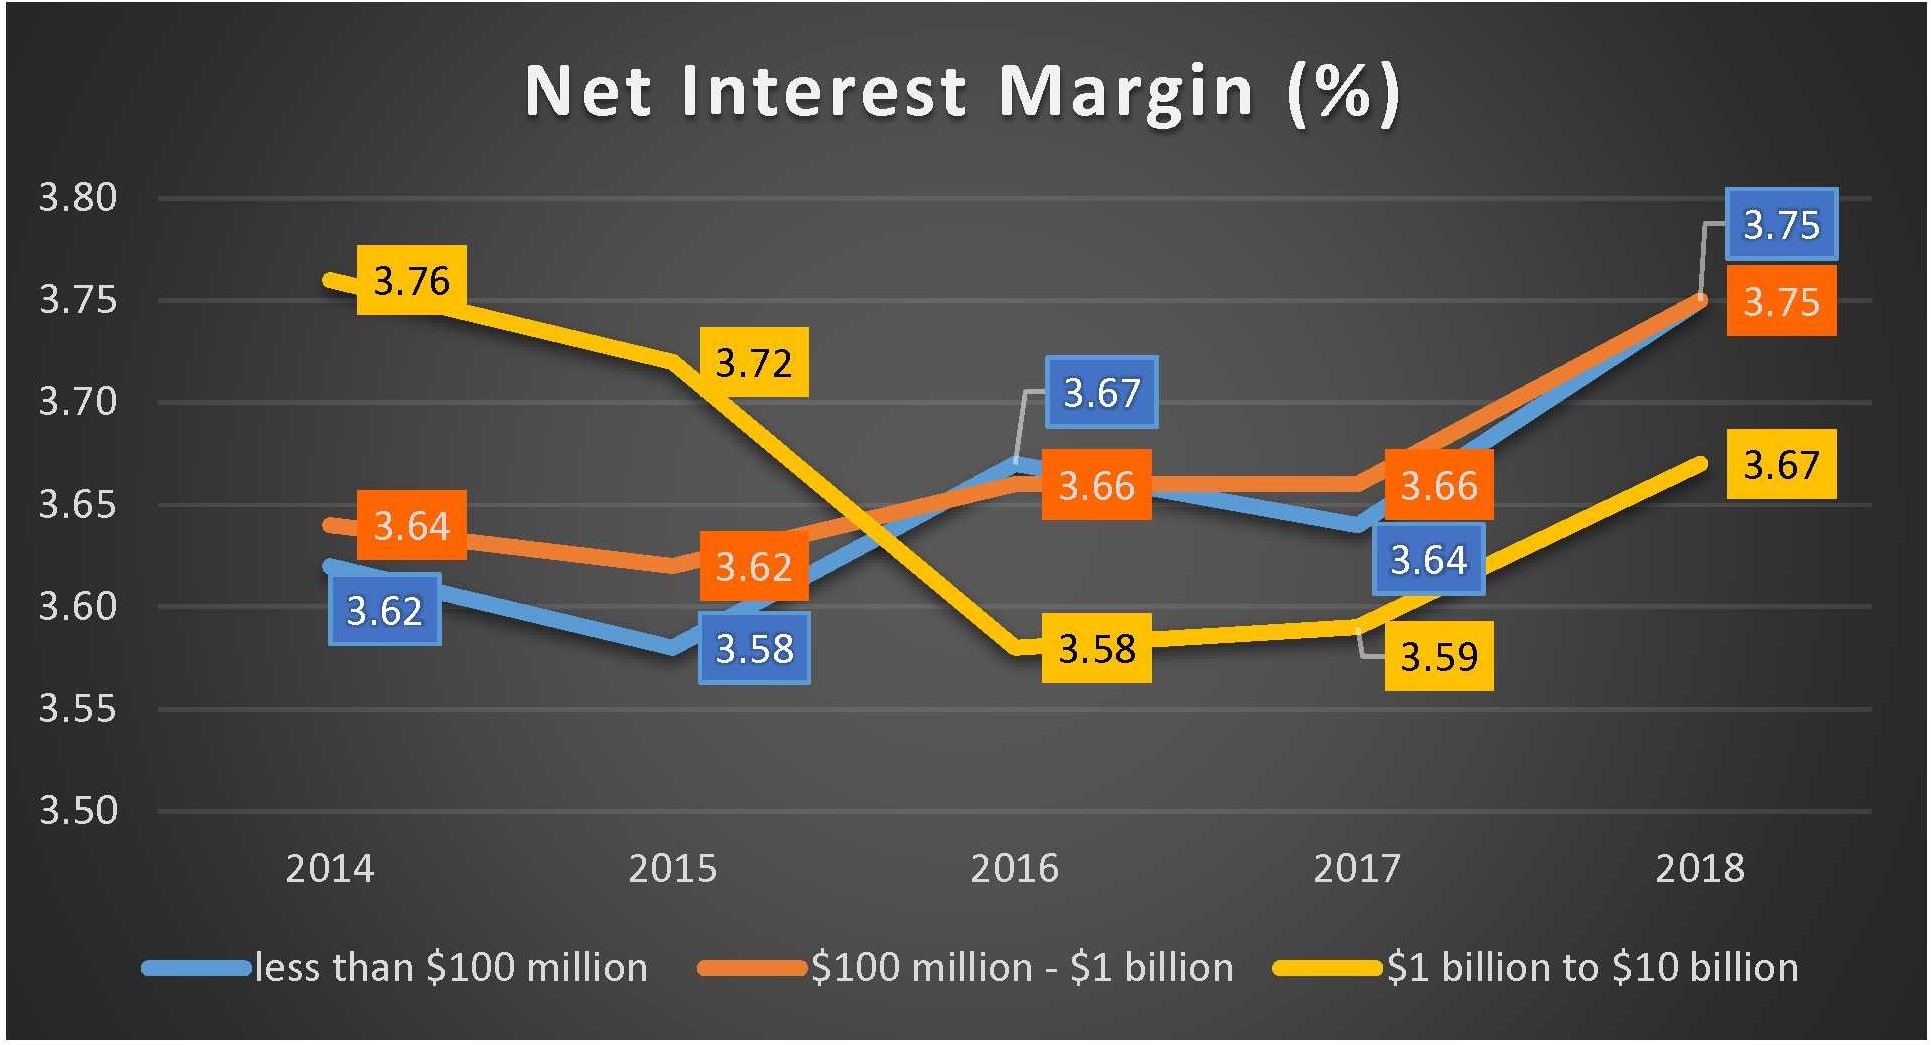
Source: FDIC Quarterly Banking Profile
Interest rate margins are great but they are not the only way that banks make profits. Technology has been a double-edged sword. On one-hand, it enables more work to be done by fewer people. On the other hand, there are added expenses from training, maintenance and especially security perspectives.
This double edge can be seen in the latest FDIC Quarterly Banking Profile which reports that average assets per employee at the nation’s community banks rose 4.4% during the 12 months ended March 31, 2018 while noninterest expense rose 6.9%.
So how does a community bank gain efficiency in this environment? A bank’s Efficiency Ratio measures how much of its operating revenue is spent on overhead. A lower ratio indicates higher Efficiency. According to the FDIC’s Quarterly Banking Profile, the average Efficiency Ratio for all U.S. banks at March 31, 2018 was 57.53%. In other words, it costs a bank, on average, 57.53 cents to generate $1 of revenue.
If you look at the chart below, however, you can see that smaller banks, as a whole, are much less efficient than larger banks. (We intentionally left off the largest banks, those with assets greater than $10 billion, but they are included in the “All FDIC-Insured” group.) There has been progress in Washington toward alleviating some of the regulatory burdens that were imposed on community banks after the Great Recesssion, but they are clearly struggling when it comes to efficiency.
The key words of course are “as a whole”. Some community banks are able to find ways to maximize Efficiency in spite of the challenges. In fact, the community banks listed on page 7 and supplement of Jumbo Rate News issue 35:30 all have more than $10 million dollars of average assets per employee and although some have more than $1 billion in assets, they are all considered community banks by the FDIC definition. They also each have an efficiency ratio of less than 60% based on March 31, 2018 financial data.
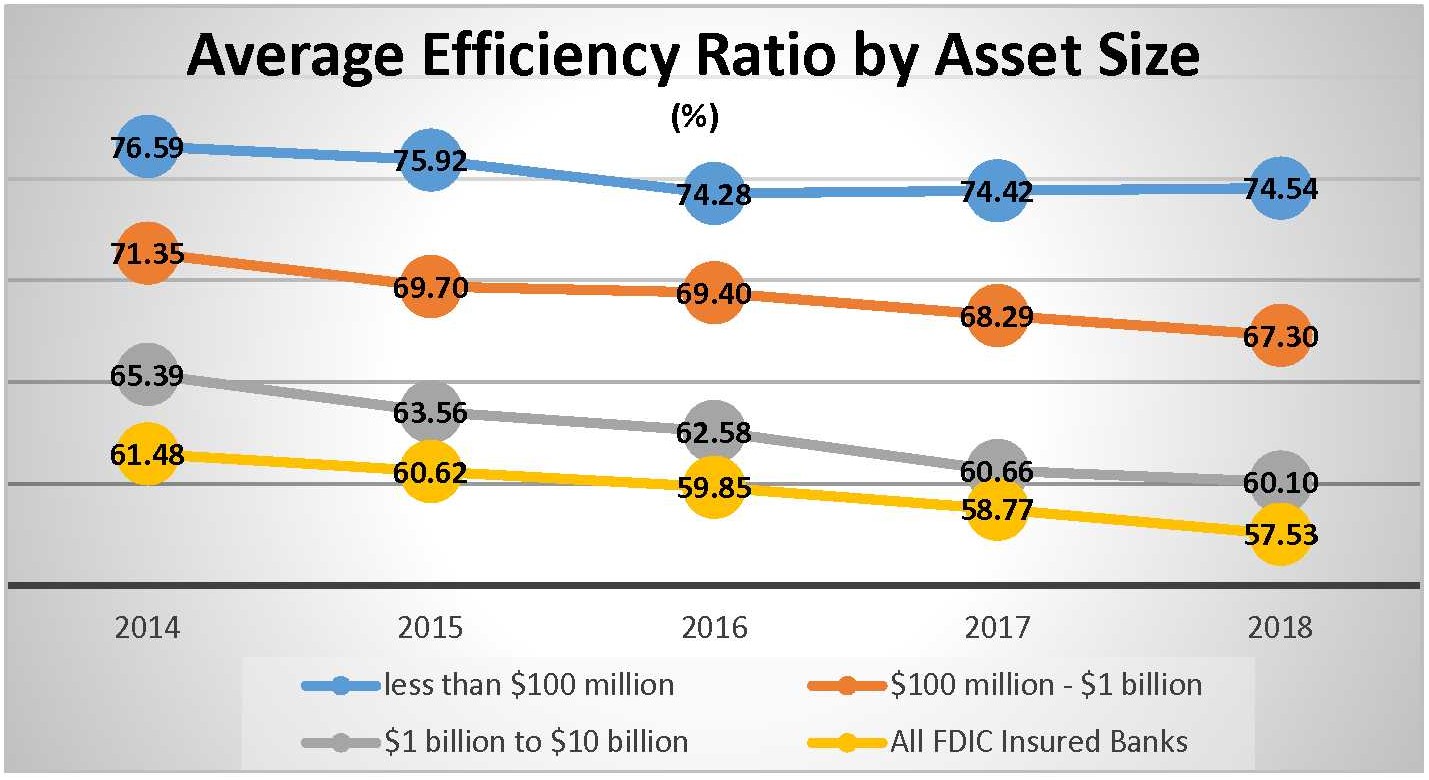
Source: FDIC Quarterly Banking Profile
These are the most efficient community banks in the country. How they have accomplished it varies from one bank to the next. For some, taking advantage of new technologies has given them a valuable edge. Others have merged or acquired other banks increasing their loan portfolios and sometimes allowing them to offer entirely new services. Another popular avenue has been to merge all of the banks under a holding company umbrella into one bank with a central operations center. Regardless of how they did it, the 147 banks listed are the most efficient community banks in the nation.